
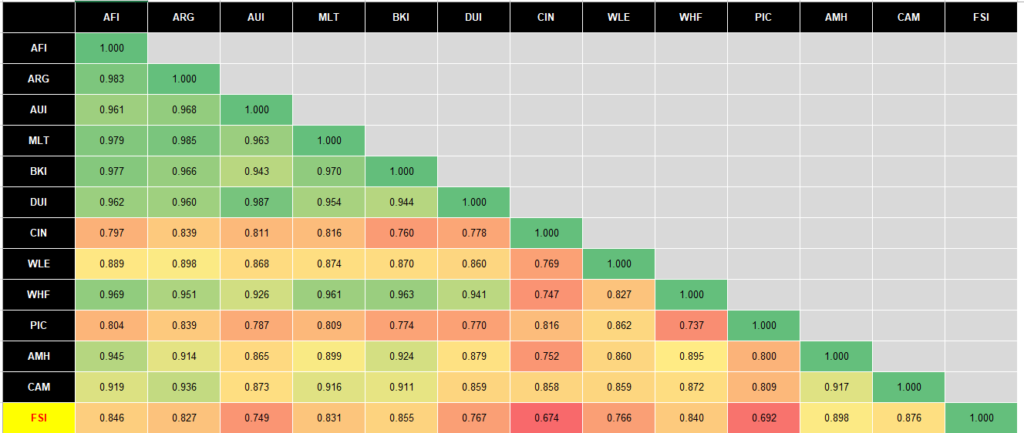
Chart 3. Source: Bell Potter. 5 Year monthly NTA correlation between Large Cap Australian Equity LICs. (Yellow highlight added by this author with permission)
The Bell Potter research report has offered a previously not seen insight into the correlation between various Australian Equities LICs and these are shown in Chart 3.
FSI, seen at the bottom, has a lower correlation to these other LICs. Further, other LICs recognised as being the traditional “big-guns” of the LIC space can be seen to have a higher correlation to one another. An argument can be made that they are almost indistinguishable. Investing in more than one of these may not provide much diversification, risk protection, or opportunity to generate excess performance.
This would be even further amplified if you already held many large-cap stocks directly and then invested in these high-correlation LICs. You could be “tripling up” and incurring unnecessary direct cost and opportunity costs. Also, don’t forget that your super fund probably has a large allocation to these same stocks too. FSI on the other hand has a lower correlation to all the other Australian Equity large-cap LICS and is clearly differentiated, offering potential investment diversification.
[NB It should be noted that the other lower correlation LICs in this table in CIN and PIC are specialist LICs: PIC is ¼ international holdings and CIN holds nearly 40% of its portfolio in just the 1 stock – Event Hospitality and Entertainment Ltd.]