Dr Manny Pohl AM, Chairman of EC Pohl & Co, together with the Conservation department of the Art Gallery of NSW, hosted a cocktail party to celebrate the completion of the conservation of the important painting The Five Senses by Carlo Cignani and to acknowledge that Sophie Mitchell has retired as Director of Flagship Investments.

A delightful night was had by all as the NSW Art Gallery shared the completion of the conservation of Carlo Cignani’s (now) spectacular painting The Five Senses.

Five Senses Final

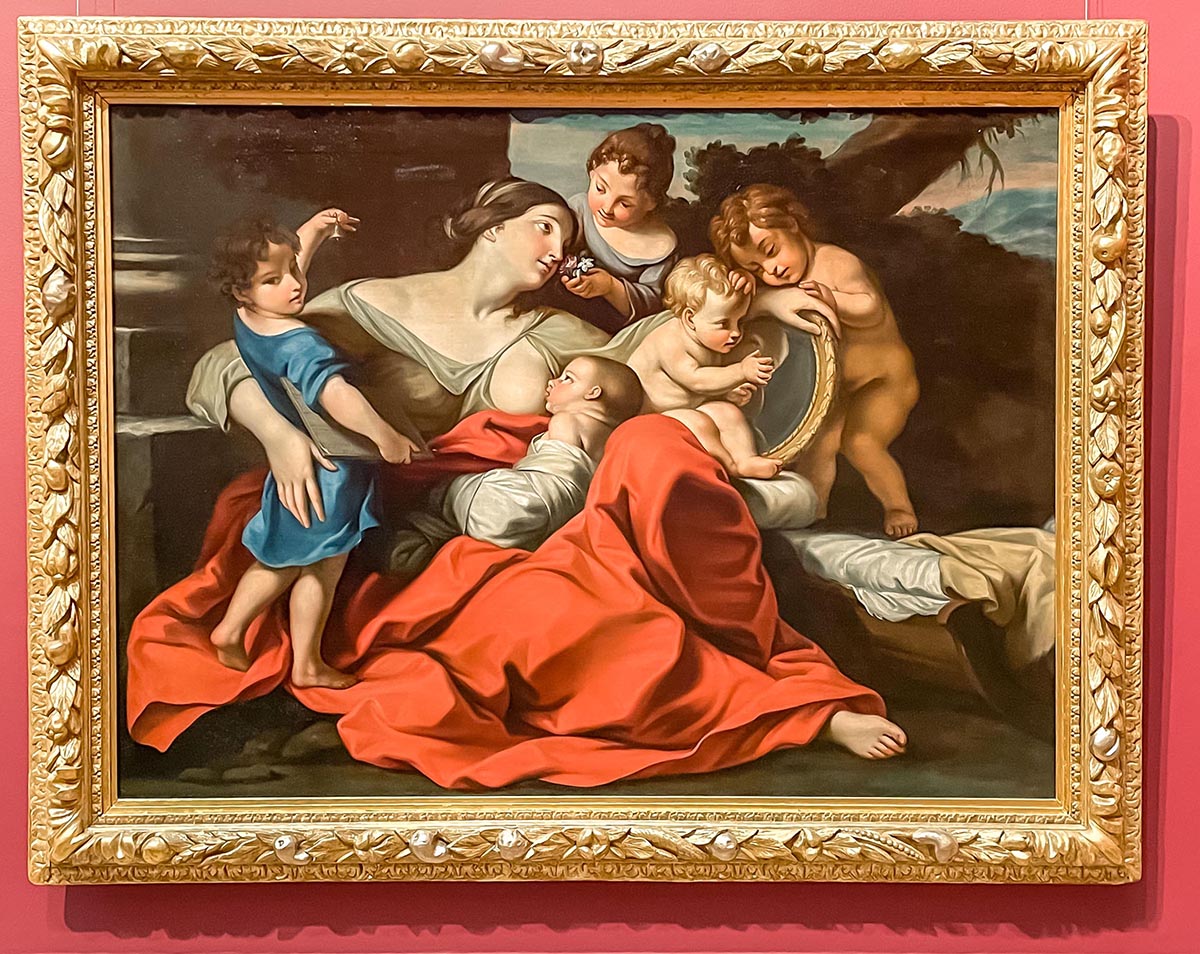
We really are very grateful for the support provided by the Pohl Foundation, which has allowed the conservation team to play a vital role in the Art Gallery’s core mission to ‘acquire, study, conserve and present’ significant works of art in order to connect people to creativity, knowledge and ideas. As well as be enjoyed by future generations.

During the event, we took the opportunity to acknowledge Mrs Sophie Mitchell for her work with Flagship Investments as she retired from her position late last year. Sophie has served as a Director since 2008 and Chair of the Audit and Risk Committee and has played a significant part in steering the successful strategy of the Company. We wish Sophie all the best in her future endeavours.

In an August article first published on this website the performance and correlation of the Flagship Investments (FSI) portfolio was compared to other Listed Investment Companies (LICs) that primarily invest in Large Cap Australian shares. One of the things shown in this research was that many of these LICs have a very high correlation to one another. The performance of many is similar and that was a result of the bulk of the investments within their portfolio being much the same.

Flagship was shown to have a lower correlation and for those building a portfolio of LICs its differentiation (and strong performance) validated its place in portfolios. Six months on we revisit current performance data to identify if there have been any noteworthy changes or whether FSI continues to remain a worthy inclusion and offers differentiation from other LICs.

Strong Performance

Table 1 – LICs returns over a period of time.

In table 1 we can see that while the FSI portfolio has had a relatively flat 12 months – where we would like to think that potential value in the portfolio has been building – we can see over 3 and 5 years it is the stand out performer demonstrating the competent and superior stock selection skills of the investment management team.

FSI for Diversification

Chart 2. 5 Year monthly NTA correlation between Large Cap Australian Equity LICs – names removed.

Research by Hayden Nicolson, Bell Potter Securities LIC/ ETF specialist, offers a rarely-seen insight into the correlation between various Australian Equities LICs and these are shown in Chart 3.

Chart 2 is provided as a prelude to Chart 3 to help readers new to Correlation Matrixes better understand what data is being shown. [If you understand matrixes you can skip a few paragraphs ahead.]

Essentially the Degree of Association between variables is measured by a correlation coefficient. The correlation coefficient is measured on a scale that varies from + 1 through 0 to – 1. Complete correlation between two variables is expressed by either + 1 or -1. When one variable increases as the other increases the correlation is positive; when one decreases as the other increases it is negative. The complete absence of correlation is represented by 0.

Figure 2 gives some graphical representations of the correlation between the performances of various investment products. If we look at cell B2 we can see that LIC A has a perfect correlation of 1.00 to itself. If we look down a row into cell B3 we see the number 0.98. That means that (in this example) LIC A has a 0.98 correlation to LIC B. If we glance over to cell B9 we can see LIC A has a 0.97 correlation to L IC H. You will see a lot of grey in matrixes and that is just for simplicity to remove what would be duplication of numbers to help with ready reading. By this, if you look at Column D you will see there are grey squares in cells D2 and D3. The data that would fit in those cells is also found in cells B4 and the data in cell C4 would also go into cell D3. By looking up and down and across rows and columns you can observe the correlations between all variables to one another- which in this case is the 5 Year monthly NTA correlation between 12 Large Cap Australian Equity LICs.

Looking into this table you can see that the movement in the monthly performance of LIC B is very closely matched by that of the other LICs, with the exception of LIC F (0.87), LIC I (0.86) and LIC L (0.85). The most differentiated LICs are LIC F, LIC I and LIC L. The correlations between LICs A, B, C, D, E, H, J & K are so high an investor who held 2 or more might do well to consider if they are just duplicating their investment at additional cost?

So, where does Flagship fit in this table?

Chart 3. 5 Year monthly NTA correlation between Large Cap Australian Equity LICs.

The big reveal

It may be of little surprise to many FSI shareholders that it was LIC #12, in row 13 at the foot of the table. The reason it would be unsurprising is that they are aware that FSI has a unique and differentiated portfolio and – unlike so many other LICs – is not merely a replication of the ASX top 20.

(It should be noted that the other lower correlation LICs in this table in CIN (row 7) and PIC (row 9) are specialist LICs: PIC has nearly ¼ invested overseas and in cash and CIN holds 43% of its portfolio in just the 1 stock – Event Hospitality and Entertainment Ltd.)

One can instantly see that FSI has a lower correlation to these other LICs. Further, other LICs recognised as being the traditional “big-guns” of the LIC space can be seen to have a higher correlation to one another. An argument can be made that they are almost indistinguishable. Investing in more than one of these may not provide much diversification, risk protection, or opportunity to generate excess performance.

As was noted in the August article this would be even further amplified if you already held many large-cap stocks directly and then invested in these high-correlation LICs. You could be “tripling up” and incurring unnecessary direct cost and opportunity costs. Also, don’t forget that your super fund probably has a large allocation to these same stocks too. FSI on the other hand has a lower correlation to all the other Australian Equity large-cap LICS and is clearly differentiated, offering potential investment diversification.

Summary

FSI remains distinguishable from other large-cap Australian Equity LICs by its long-term outperformance and its differentiated investment holdings on both an NTA and Share Price return basis where it is a table-topping LIC. While many Large Cap Australian Equity LICs remain are barely distinguishable to one another FSI presents itself for consideration of portfolio inclusion due to both its performance and also it is a differentiated portfolio to other LICs, the index and those household name stocks many investors may already hold. FSI performance has not come by luck but through superior stock selection. It is no surprise that for over 20 years FSI has been recognised for being a leading investor and identifier of what often become the “stocks of tomorrow” and market darlings.

Disclaimer and important note
This article is provided for information purposes only to stimulate the reader to undertake their own research into various investment companies and products. Investors should not rely on this article which does not take into account any person’s particular investment objectives, financial resources or other relevant circumstances, and the opinions and recommendations in this article are not intended to represent recommendations of particular investments to particular persons. All securities transactions involve risks, which include (among others) the risk of adverse or unanticipated market, financial or political developments. Past performance is no guarantee of or predictor of future performance.

Logo
Share Img

Share This

Select your desired option below to share a direct link to this page.
Your friends or family will thank you later.